
Recovering RAID Arrays with Lost Configurations: The Statistical 'Histogram' Technique
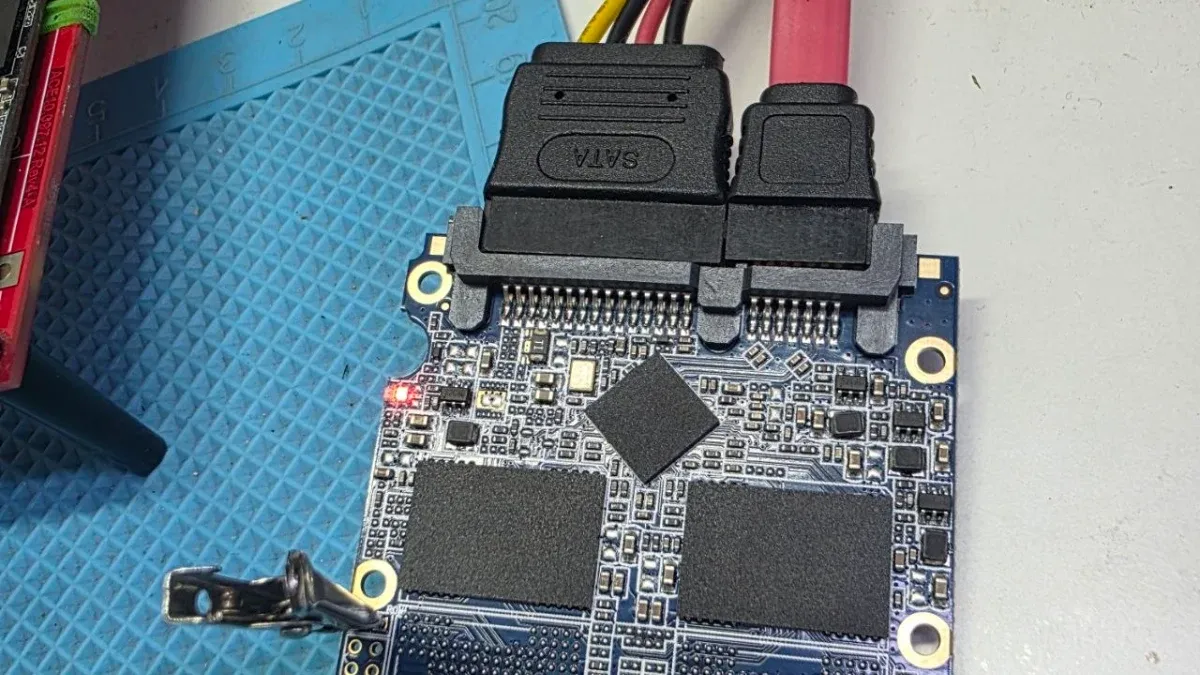
Recovering data from arrays with a “Lost Configuration” is one of the most formidable challenges in data recovery engineering. In these scenarios, the drives lack the metadata required to define drive order, stripe/block size, or data offsets. At Datacodex, we utilize an advanced protocol based on statistical “Histogram” analysis—the Array Fingerprint—to infer these parameters with mathematical precision.
The Engineering Challenge of Missing Metadata
When a RAID array fails due to controller malfunction or a destructive rebuild with incorrect parameters, the distribution map is lost. Relying on brute-force methods to guess the drive order is impractical; for instance, a 7-drive array has thousands of possible combinations. This necessitates a content-aware methodology, specifically utilizing file carving (RAW Recovery) to build a statistical model of the array.
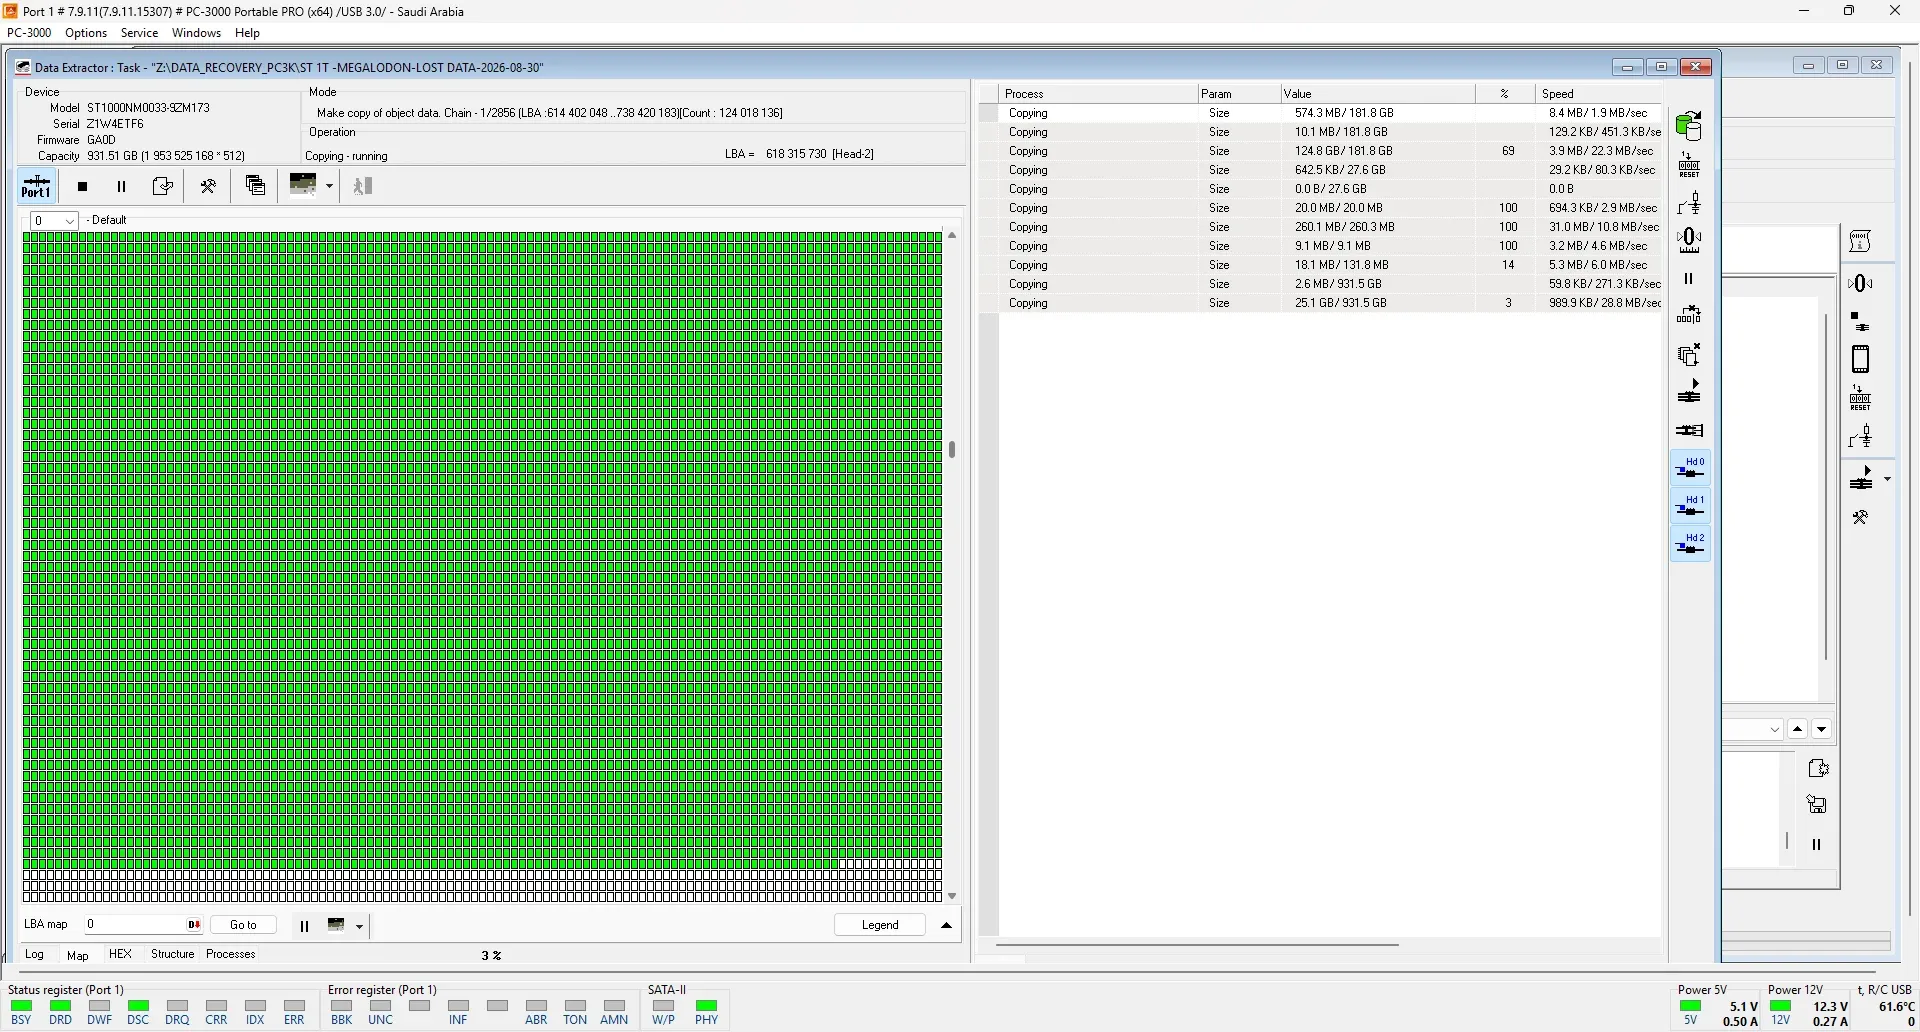
Histogram Analysis Methodology
The Histogram technique leverages a fundamental technical reality: user data blocks contain high densities of file headers and integer file parts, whereas redundancy blocks (XOR or Reed-Solomon) lack these structures or contain only minimal “noise”.
By performing a comprehensive RAW Recovery across all members, we map the location of intact file segments that do not cross block boundaries. Plotting this data graphically reveals “Peaks” in data regions and “Gaps” in XOR regions, creating a unique fingerprint for the array.
Technical Parameter Inference
By analyzing the graphical representation of the fingerprint, our engineers can accurately determine the following:
- Stripe/Block Size: Measured by the distance between auxiliary lines marking the transition from data areas to redundancy areas.
- LBA Offset: If the data patterns do not initiate at sector 0, the Histogram clearly displays the exact sector-based offset.
- Parity Delay: In specific arrays (e.g., HP/Compaq), this manifests as repeating groups of blocks before the parity moves to the subsequent drive.
Reconstruction and Verification Protocol
Once the block size and offset are established, we use the fingerprint to identify the XOR Diagonal. This allows us to narrow down the possible distribution algorithms (LA, LS, RA, RS) to just four variations instead of thousands.
At Datacodex, the process concludes by assembling the array “on-the-fly” and verifying the integrity of the file system structures, such as the Master File Table (MFT) in NTFS or the Superblock in Linux environments. If the statistical fingerprint aligns with the logical file system geometry, the final data extraction process begins.
Need professional help?
Our experts at Al-Fares Center are ready to recover your data using state-of-the-art technology with a 95%+ success rate.